What Is a Good ROAS in 2026? Start With Break-Even ROAS

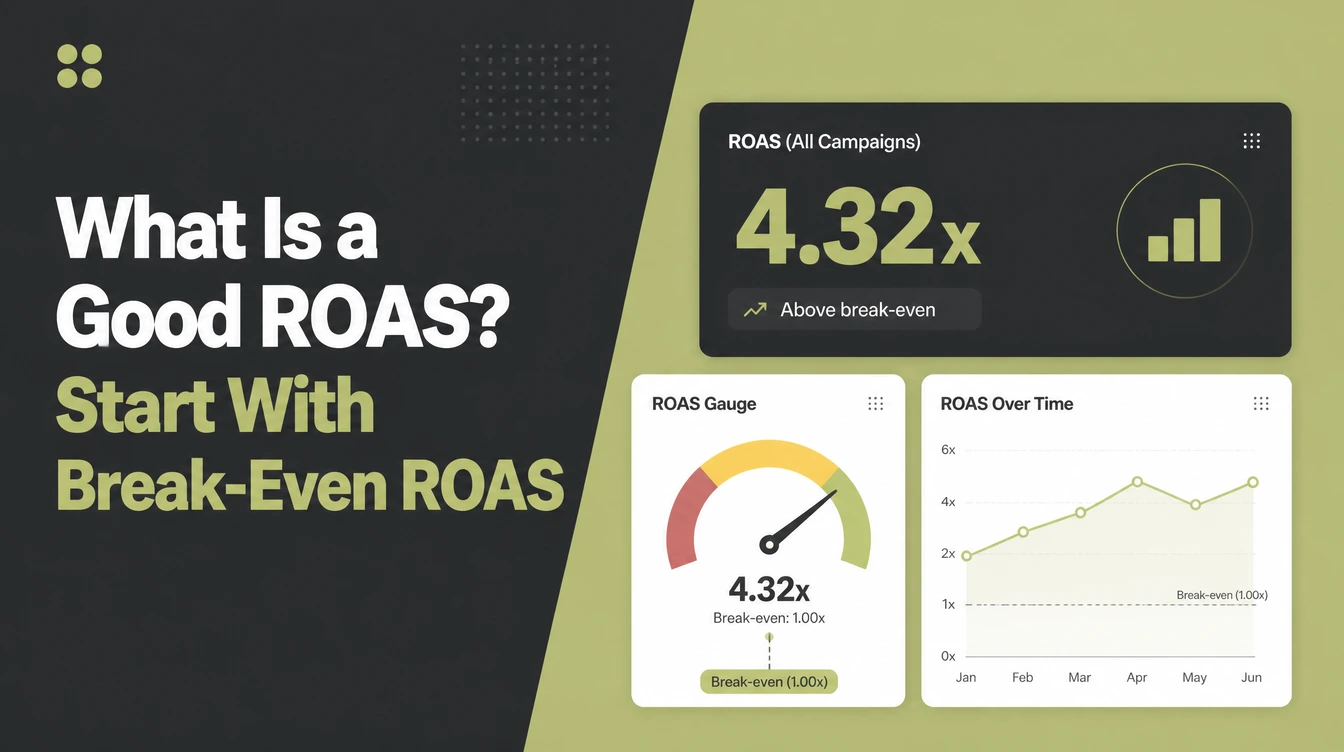
A good ROAS is any figure above break-even ROAS, calculated as 1 divided by profit margin. A 25% margin needs 4 to 1, while a 50% margin needs 2 to 1. WordStream says common benchmarks fall between 3 to 1 and 4 to 1. Seed Light judges campaigns against the break-even line.
Key takeaways
Short on time? Here is the whole answer in five lines before we break it down.
- There is no universal good ROAS. One report found there is "no universal good ROAS" at all (Triple Whale, 2024).
- The rules of thumb are loose. A common one is 4 to 1, and many benchmarks fall between 3 to 1 and 4 to 1 (WordStream).
- Your real target is break-even ROAS. The formula is 1 divided by your profit margin (Midsummer).
- ROAS is not profit. It tracks revenue earned by ad spend, while ROI is the broader picture (Shopify).
- You cannot judge any of it without tracking. Conversion tracking is what makes the number real.
1. What ROAS is and how to calculate it
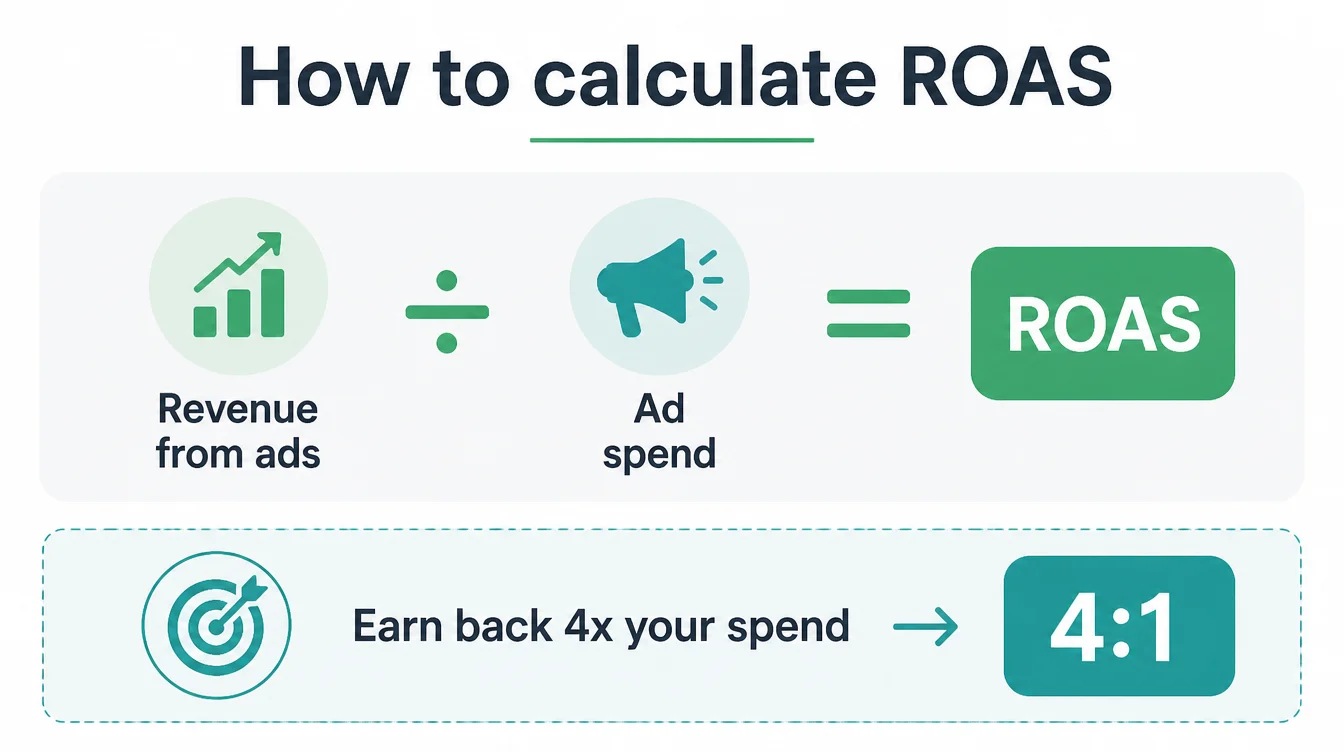
ROAS stands for return on ad spend. In plain terms, it answers one question: for every unit you put into ads, how much revenue came back out? You work it out by dividing the revenue your ads brought in by what you spent on those ads.
So if your ads earned four times what you spent, your ROAS is 4 to 1. People also write that as a plain "4" or "four times." It is a ratio, not a percentage.
Google describes a target ROAS as "the average conversion value ... you'd like to get for each dollar you spend" (Google Ads Help). That is the whole idea: revenue per unit of spend.
ROAS shows up most in paid advertising, especially on Google and social platforms. If you are new to running paid traffic, start with our plain guide to Google Ads for small business first, then come back to judge your numbers.
2. ROAS is not the same as profit (ROAS vs ROI)
This is the trap that catches most owners. A 5 to 1 ROAS sounds great. Yet you can still lose money on it. Here is why.
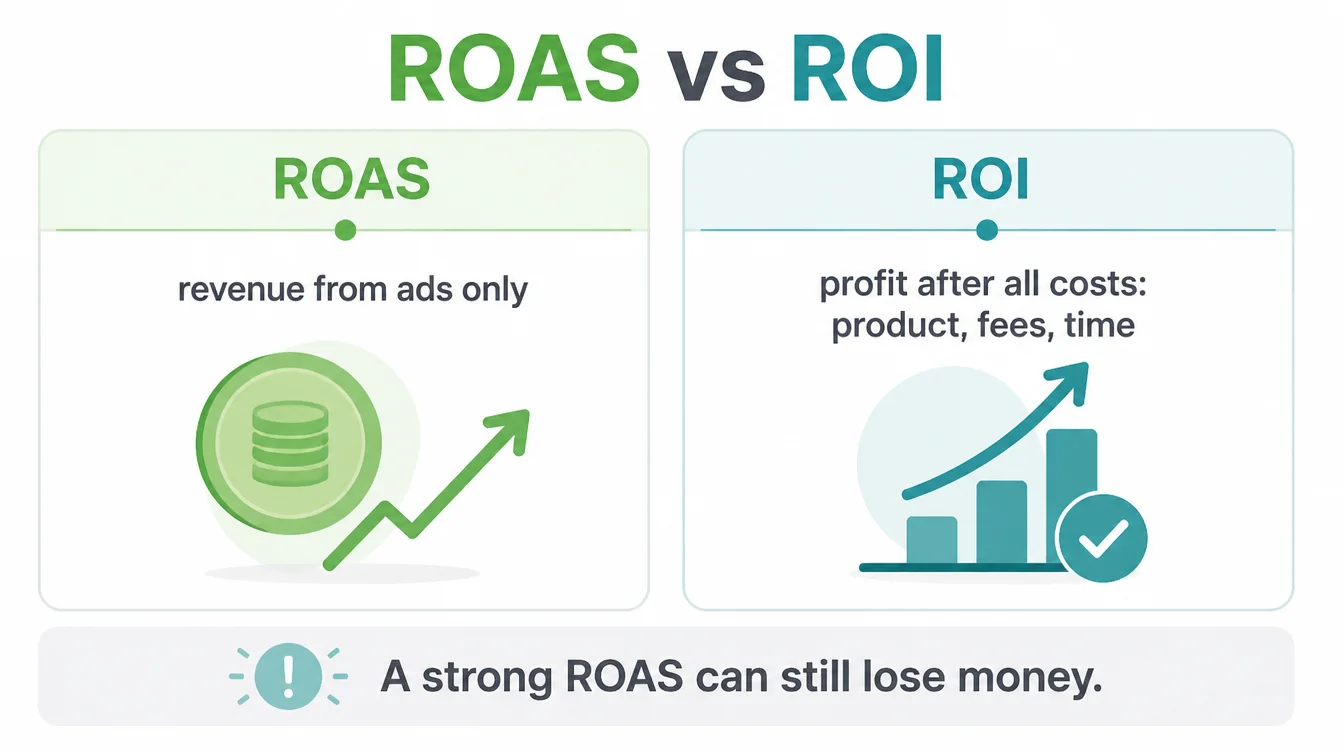
ROAS only counts revenue. It ignores the cost of the product, fees, shipping, and your own time. ROI, on the other hand, counts those costs, so it measures real profit. As Shopify puts it, ROAS "focuses on revenue earned by ad spending" while ROI is the broader picture (Shopify).
Think of it this way. ROAS tells you if the ad channel pulls its weight. ROI tells you if the whole business comes out ahead.
You need both, because a strong ROAS on a thin margin can quietly leak money. To see how this fits the bigger plan, read our pillar on digital marketing for small business.
3. Is there a universal good ROAS? (No)
Short answer: no. People want one tidy number, and the internet keeps offering them. But the honest research says otherwise. One analysis flatly states there is "no universal good ROAS," and the median ROAS for brands it studied was about 2.04 in 2024 (Triple Whale, 2024).
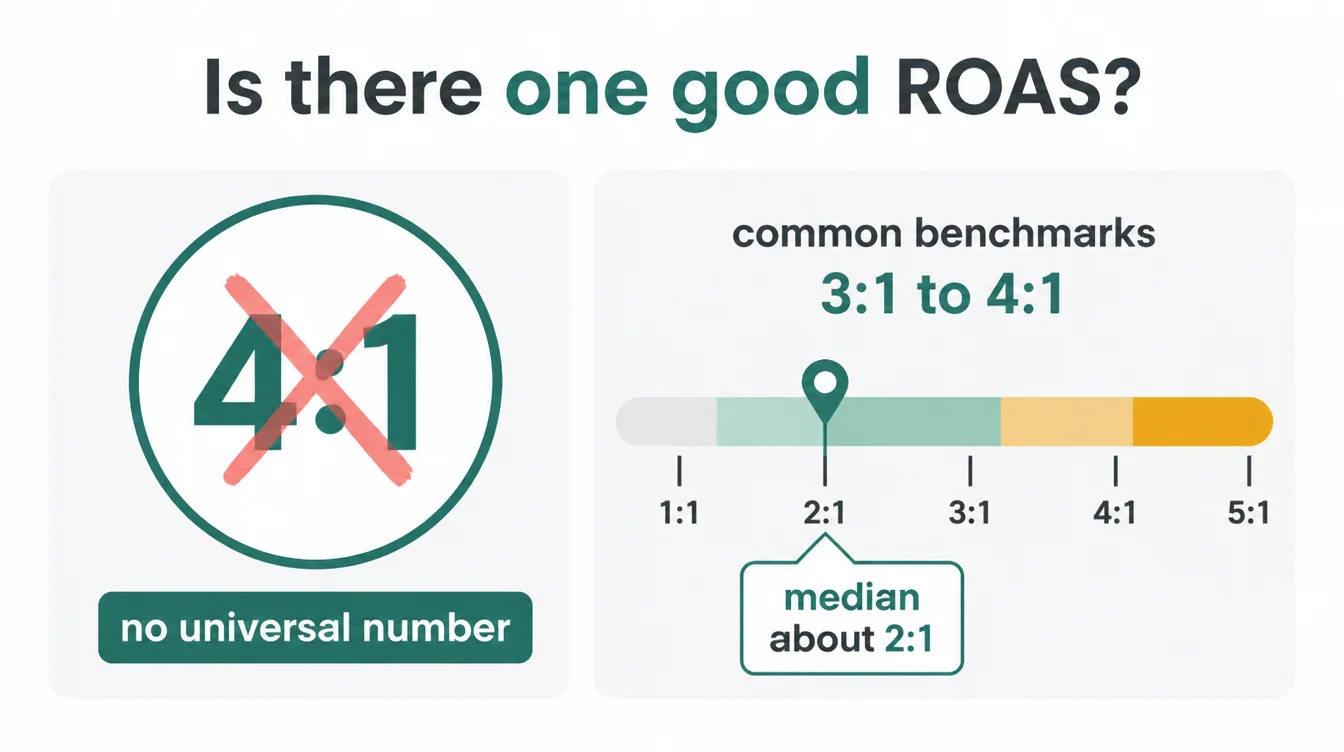
You will still see rules of thumb, and they are useful as a rough starting line. Shopify says an acceptable ROAS depends on your profit margins, operating costs and advertising goals (Shopify), while WordStream points out that "common benchmarks fall between a 3.0 to 4.0 ROAS" (WordStream).
Treat those as rules of thumb, not laws. A 4 to 1 target works for one shop and bankrupts another. Why? Because it ignores the one thing that actually decides your answer: your margin. That is where we go next.
4. The number that actually matters: break-even ROAS
Here is the number worth memorising. Your break-even ROAS is the point where the revenue from your ads exactly covers the cost of what you sold plus the ad spend. Above it, you profit. Below it, you lose money. Simple as that.
The formula is clean. Break-even ROAS equals 1 divided by your profit margin (Midsummer). So a business running a 20% margin needs a 5 to 1 ROAS just to break even.
A business with a fat 50% margin only needs 2 to 1. Our free break-even ROAS calculator works the figure out from your own margin.
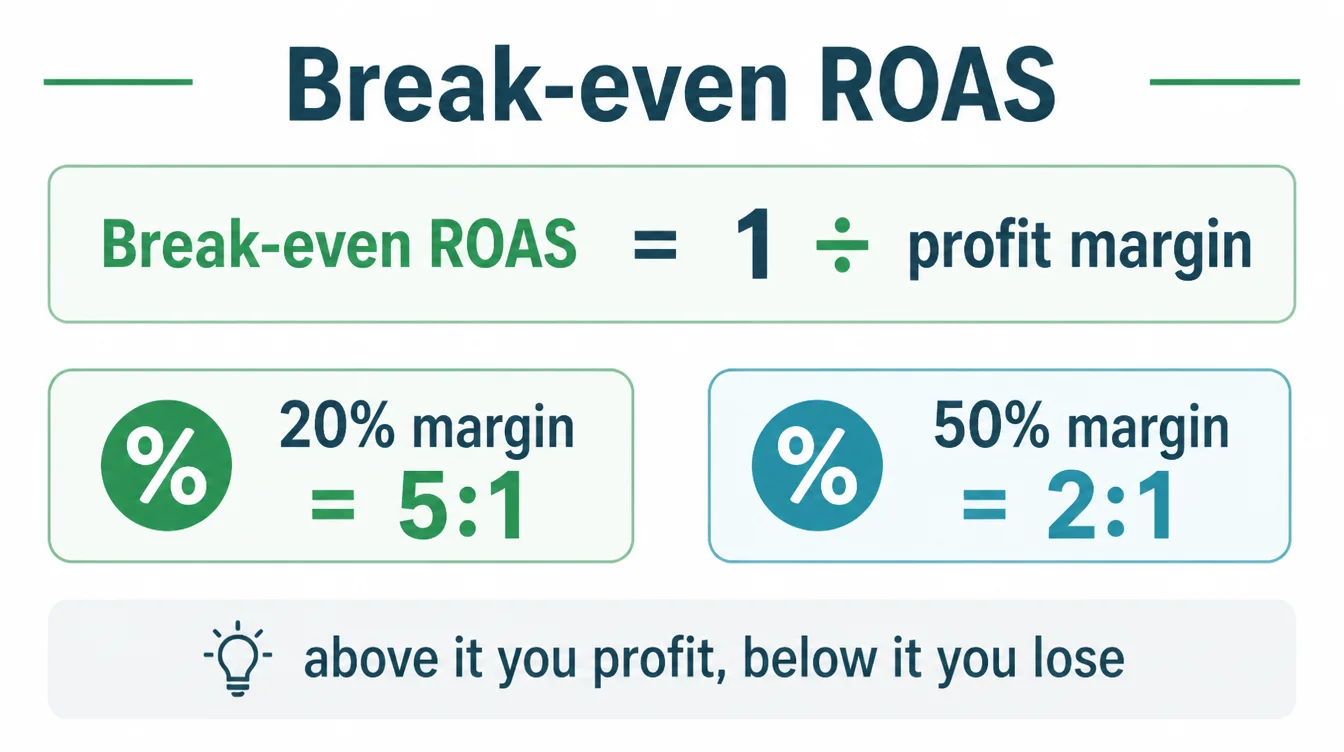
This single idea reframes everything. A "low" 2 to 1 ROAS is brilliant for a high-margin service business. Meanwhile a "good" 4 to 1 ROAS still loses money for a low-margin shop with a 20% margin. The benchmark you read online means nothing until you compare it to your own break-even point.
5. Worked examples by margin
Let us turn that formula into something you can read at a glance. The table below shows the break-even ROAS for four common margins. Find the row closest to yours and you have your real target.
| Your profit margin | Break-even ROAS |
|---|---|
| 50% margin | 2:1 |
| 33% margin | 3:1 |
| 25% margin | 4:1 |
| 20% margin | 5:1 |
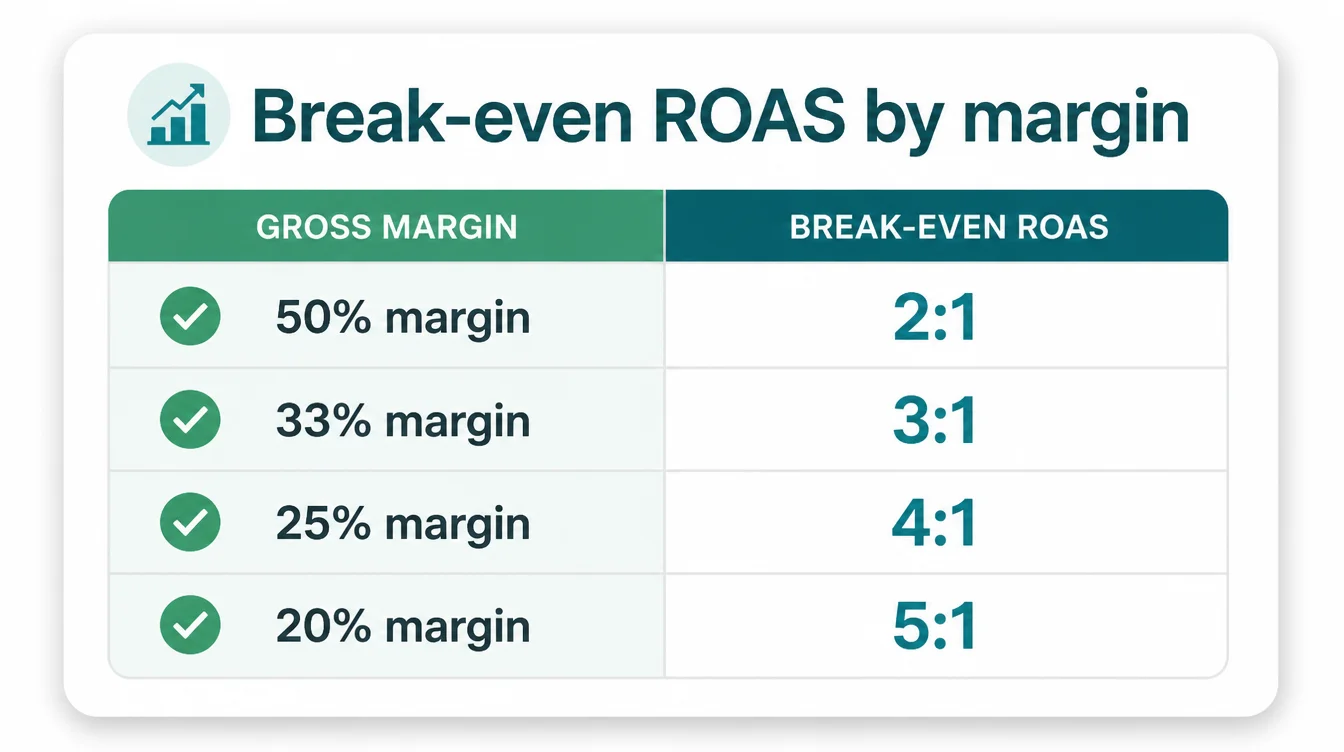
Read it the simple way. If your margin is 25%, you need to earn back four times your spend just to break even, which is why the famous 4 to 1 rule of thumb fits a 25% margin so neatly.
If your margin is 50%, you only need to double your spend. Once your real ROAS clears the number in your row, each extra sale adds profit at your margin.
6. Why a high ROAS can still be a problem (under-spending)
Now for the counter-intuitive part. A very high ROAS is not always the win it looks like. Often it is a quiet warning that you are under-spending and leaving money on the table.
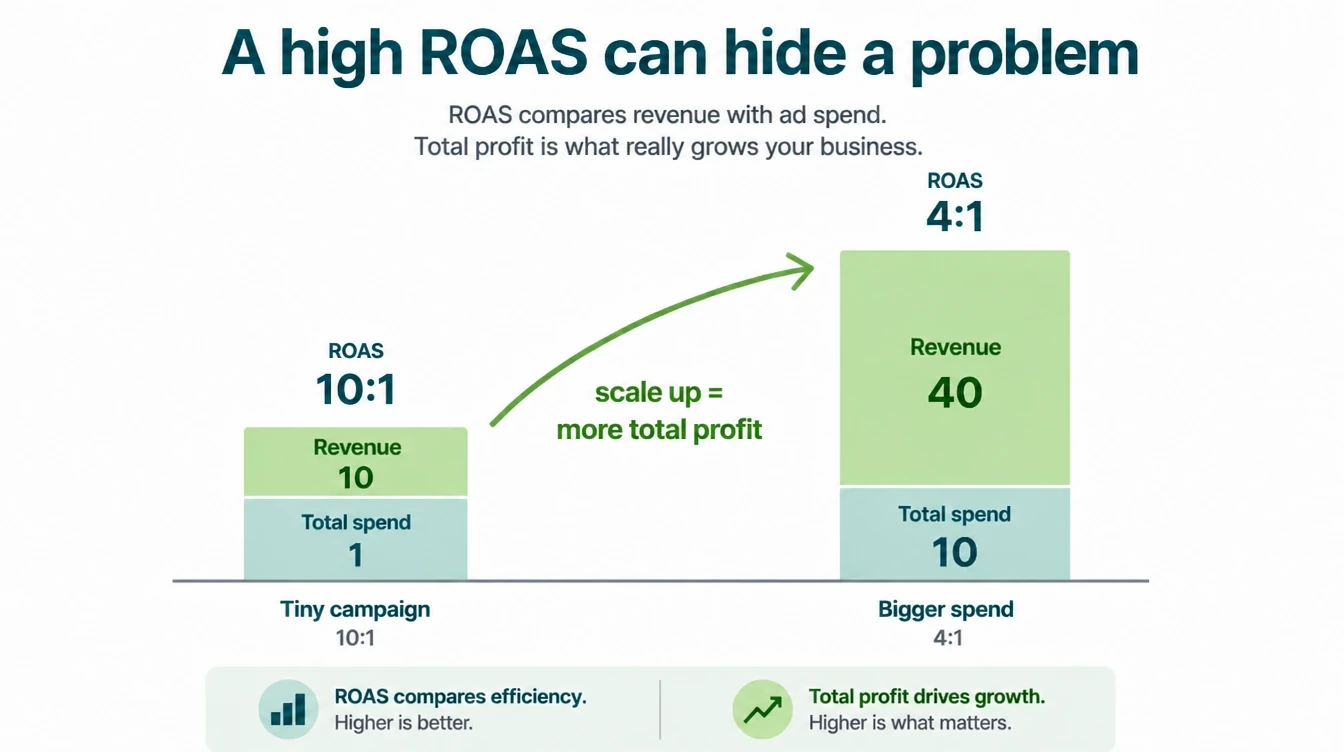
Picture a tiny campaign returning 10 to 1. Fantastic ratio. But it might only run on a handful of searches a day. If every extra unit you put in still comes back well above break-even, you are choosing a perfect-looking ratio over real growth. Scaling up would drop the ratio yet grow your total profit.
So aim for the most profit, not the highest number. A steady ROAS comfortably above break-even at higher volume usually beats a flawless ratio on a campaign too small to matter.
To weigh where to put your budget, our guide on SEO vs Google Ads and our comparison of Google Ads vs Facebook Ads both help. Our Facebook ads management page shows how a Meta campaign is set up and reported.
7. How to actually measure it (conversion tracking)
None of this works without conversion tracking. If you cannot see which clicks turned into sales, your ROAS is a guess. Google says conversion tracking helps you "understand your return on investment (ROI)" by recording what happens after the click (Google Ads Help).
Once the numbers are in front of you, our free ROAS calculator turns spend and revenue into the ratio, and our free tracking pixel checker shows which tags a page is actually loading.
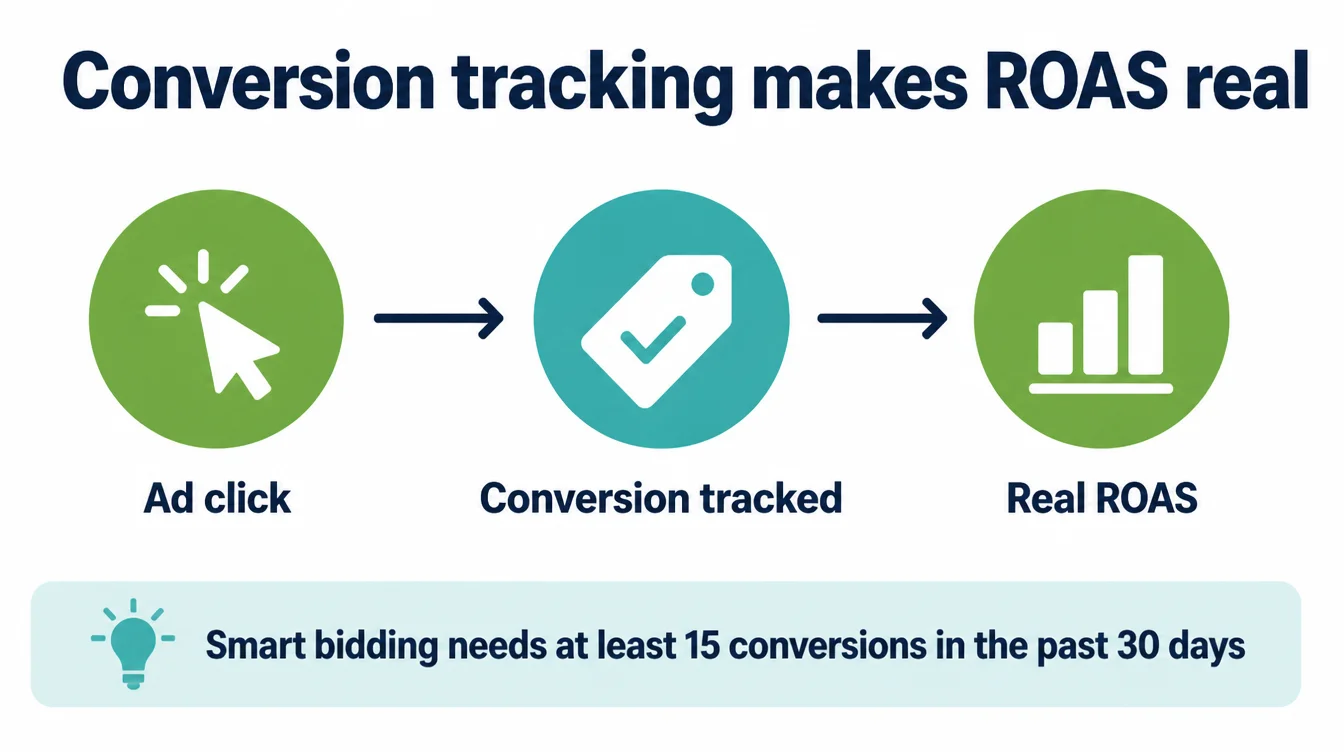
Set it up before you judge any campaign. Track the actions that matter, whether that is a purchase, a form fill, or a phone call. Then attach the real revenue value to each one so the platform can report an honest ROAS built on real sales.
One practical note for automation. If you want Google Ads to bid toward a target ROAS, it needs enough data first.
Smart bidding generally wants "at least 15 conversions in the past 30 days" to work well (Google Ads Help). Below that, you are better off judging the numbers by hand for a while.
8. How to tell if your ads are working
Pull it all together and the check is quick. First, find your break-even ROAS. Next, measure your real ROAS with tracking. Then compare the two. The table below shows what each outcome means.
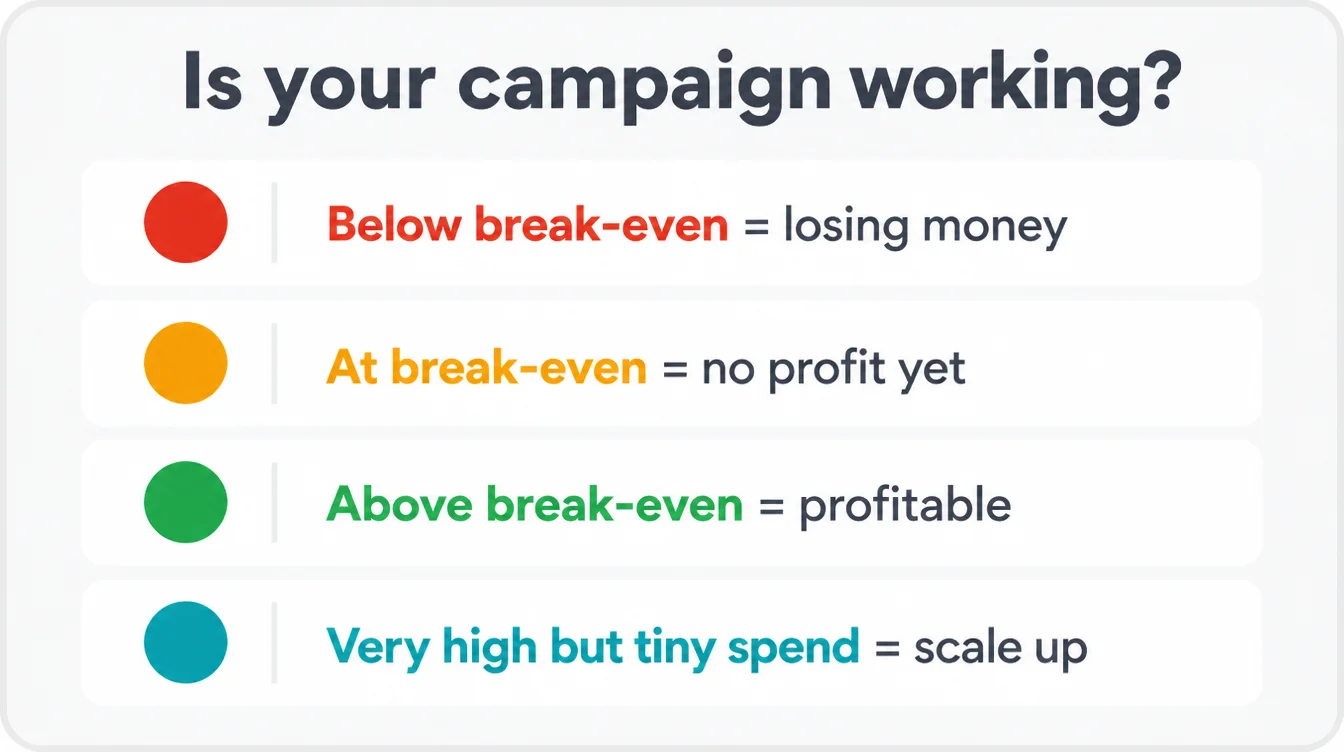
| What you see | What it means | What to do |
|---|---|---|
| ROAS below break-even | Losing money on every sale | Fix the offer, targeting, or landing page before spending more |
| ROAS at break-even | Paying for itself, no profit yet | Improve the page and creative to push above the line |
| ROAS comfortably above break-even | Profitable | Hold steady, then test spending more to grow total profit |
| ROAS very high but tiny spend | Profitable but under-scaled | Spend more while you stay above break-even |
Our own client dashboards show how wide the range is. On our results page one Meta Ads account sits at a 13x return across 3,200 purchases, while a Shopee store runs at 4.35x.
Both are profitable. They sell different products at different margins, which is the whole reason a single good ROAS number does not exist.
That is the honest scorecard. A campaign is working when it beats your break-even point and you can scale it without dropping below the line. For more plain guides, browse the Seed Light blog or see how we run digital marketing for small businesses.
Frequently asked questions
1. What is a good ROAS?
There is no universal good ROAS. A common rule of thumb puts it around 4 to 1, and many benchmarks land between 3 to 1 and 4 to 1. But the only number that truly tells you if ads are working is your break-even ROAS, which is 1 divided by your profit margin. Anything above your break-even point makes money. Anything below it loses money, no matter how the rule of thumb compares.
2. How do you calculate ROAS?
ROAS is revenue from ads divided by the amount you spent on those ads. If you earned four times what you put in, your ROAS is 4 to 1, often written as 4. It is usually shown as a ratio or a multiple, like 4 to 1. To get an honest figure, you need conversion tracking so you can see which sales actually came from the ads.
3. What is the difference between ROAS and ROI?
ROAS measures revenue earned for every unit spent on ads. ROI looks at the bigger picture and counts your costs, so it measures actual profit. You can have a healthy ROAS and still lose money once you subtract the cost of the product, fees, and your time. ROAS tells you if the ad channel pulls its weight. ROI tells you if the business as a whole comes out ahead.
4. What is break-even ROAS?
Break-even ROAS is the point where the revenue from your ads exactly covers the cost of what you sold plus the ad spend. The formula is 1 divided by your profit margin. A business with a 25% margin needs a 4 to 1 ROAS to break even. A business with a 50% margin only needs 2 to 1. Below your break-even point you lose money, and above it you profit.
5. Is a higher ROAS always better?
Not always. A very high ROAS can mean you are under-spending and leaving sales on the table. If every extra dollar you put into ads still comes back profitable, a sky-high ROAS suggests you could scale up and earn more total profit, even if the ratio drops. The goal is the most profit, not the highest ratio, so a steady ROAS above break-even at higher volume often beats a tiny, perfect-looking campaign.
6. How do I measure if my ads are profitable?
Set up conversion tracking so the platform records which clicks lead to sales. Then compare your actual ROAS against your break-even ROAS, which is 1 divided by your margin. If your ads beat break-even, they are profitable. If they fall short, they are losing money even when the revenue looks good. Without tracking, you are guessing, so accurate measurement comes first.